It has been a while since I last updated my portfolio; in fact I have made many transactions but was lazy to cover them.
Short Term Punts
Bought Sarine Tech at 0.94. Initially, I thought Sarine would be a good deal at 0.94 because it was a low leveraged company with strong cash flow. However, it seems its business condition is deteriorating and I was lucky to offload it at 0.95.
DISA- A penny stock which I noticed trades in the range of 0.012-0.016. Purely speculative, bought 0.013 sold at 0.015.
IPOs- This year I had been fairly lucky as I was allocated shares for the all 2 IPOs i applied- RE&S and No signboard. Following from Mr IPO ratings, they were a hit & run for me in the first day of trading.
Diversification
The blood of a value investor still runs in me! Fortunately during the past 3 months, I was able to locate one small gem besides accumulating more First Ship Lease Trust - Miyoshi. It is a precision engineering company, which was producing a free cash flow yield of 7+% when I bought it at 0.072. Not very great but I am running out of options in searching for value Gems on the SGX.
I have added Dutech at 0.335. Dutech is in the business of manufacturing ATM machines and safes globally. Recently, its profits has been hampered by the increase in China steel price. I am hoping the company's margins for its product will improve.
Wednesday 27 December 2017
Sunday 24 December 2017
Lesson on the Gift of Compounding: Save Young and Be Rich Sooner
Interest Compounding has a wonderful effect on our savings. When you start young and let compounding work its magic, achieving your retirement goal is very easy. This is why many financial bloggers including, yours truly, espouse on the importance of starting to save in the early stages of working life.
Using Mathematics
Regular readers of this blog will know of my penchant of relying on boring Mathematics to convince, so here comes the maths :)
Two individuals, Alan and John, enters the workforce at 25.
Knowing the effects of compounding by saving when young, Alan decides to set aside $10,000 yearly from age 25 to 60. John, on the other hand, being a millennial with a YOLO life, only realizes during his mid-career the need to plan for retirement. John immediately starts to set aside $20,000 yearly from age 40 to 60. Both Alan and John invests in the same investment which yields a 5% return per year. Instead of copying and pasting an entire Excel Worksheet, let me spare readers the agony.
At age 60, Alan would have a retirement saving of $1,006,281 while John would have a retirement saving of $750,104.
To summarize, while Alan saved half the quantum of John's, the fact that Alan had started 15 years earlier than John, places Alan on a better retirement footing financially.
The Story of the Tortoise and the Hare
During our school days, we have been taught of the idiom "slow and steady wins the race", financial freedom is exactly like this. Be the tortoise who starts the race early and run slowly; Not the hare who slept at the start and had to run doubly hard because he had fallen too far behind.
Saturday 21 October 2017
3 Things People Forget to Consider when Investing in a Condominium Property
Recently, Channelnewsasia covered a topic asking whether Singapore's private housing market is in a bubble. In it, a certain property firm’s "expert" was interviewed. One fact which made me interested is how annual rental yields of Condominiums in Singapore are now between 2.8% - 3.2%.
Having been in the real estate and investing on my own, my perception is that these figures do not reflect the reality for investors buying a private property to rent out for investment purposes. In my opinion, it seems 3 significant expenses may have been forgotten/ignored by property investors when computing the rental yield:
1. Property Tax
This is the biggest factor which many seem to have forgotten. In Singapore, the property tax is determined by the annual value of your property and for properties renting out, it is based on the annual rental income of the rented property. The base tax rate is 10% and moves up to a max tier of 20%. E.g., if your monthly rental to a tenant is $3,000, the annual value of your home is $36,000 and will incur a tax expense of $3,720. You can find the link to property tax here.
Cost relative to monthly rental income: 1.20 - 1.40 months (Variable cost)
2. Monthly Fees for Maintenance
Unlike HDB flats where our town council helps maintain the amenities, Condominiums have their own MCST that is in charge of maintaining the condo’s compound and amenities. Each owner pays a monthly fee (proportional to their housing unit’s size). For many, the monthly fee to the MCST is about $250-$300.
Cost relative to monthly rental income: Approx 1.10 -1.25 months (Fixed Cost)
3. Commission to Agent
Commission is about 0.5 months per rental year of lease.
Cost relative to monthly rental income: 0.5 months
With these 3 main factors and small items such as Insurance etc., a landlord (owner) will incur a cost equivalent to 3 months’ rental income for every 1 year of rent secured. And this is under the assumption that the condo is always rented out (in fact, our country is now facing a 10+% vacancy rate).
To summarize, if a Condo is touted to give a 3% yield, its true yield to the owner is about 2.25% (factoring the above mentioned costs).
Afterthoughts
This got me wondering if people investing in private properties now are fully aware of how low the yields they are getting and the financial perils associated with such a low yield.
It is true current interest rates for a private housing loan is low, ranging from 1.6% -2.0%. But a simple hike in interest rates of 0.75% (3 rate hikes equivalent in the federal reserve context) will mean the housing loan interest rate exceeds that of the condo’s yield. 10 years ago, Singapore’s housing loan interest was in the region of 4% p.a and if we were to look further into history, the rates were higher than 4%. A reversion to the mean of about 4% p.a is a likely scenario based on history.
It may end up a situation where investing in a private property eats into your cash flow or that instead of becoming an investment for retirement, it becomes a liability to you; serving only the bank's bottom line or as taxes contributing to the nation building of Singapore.
Saturday 16 September 2017
How Much is ComfortDelgro Worth?

Challenged by Grab/Uber in the taxi segment, ComforDelgro (CDG) taxi's segment has been hit hard and its taxi division has been suffering with declining profits. While others will focus heavily on CDG's Taxi business, it is worth noting CDG is quite diversified across many sectors.
So lets analysis CDG's sector by sector and try to find the valuation of the group on a whole based on its projected profits.
Public Transport Segment
Almost everyone is familiar with this segment which involves SBS Transit running bus and train operations. Due to the industry overhaul by LTA, SBS transit is moving towards an asset light structure, becoming an operator with no ownership of the assets. The profit segment is relatively stable and one can reasonably expect this segment to generate s$170 million per year.
Profit: s$170 million
Taxi Segment
This is the most contentious segment right now. While the taxi segment has been generating close to s$150 million yearly, the increasing competition from Private Hire Vehicles is pushing the fleet utilization and rental rates of CDG taxis down. To make matters worse, CDG had paid high prices for the COEs of its taxis in the recent few years. This makes its fixed cost high and it does not help that fleet's utilization rates are falling as well as rentals.
Hiring private rental cars cost about s$70/day and drivers enjoy rental rebates when driving for Grab/Uber, while renting from CDG starts from $90/day. If CDG is to reduce its rental rates by 20% to match competition, it is likely to lose all its profits. Hence, I do not expect CDG to slash its rental rates by 20% but instead 10+% to retain its profitability.
In its recent past two quarters report, CDG reporting results has shown a slow decline in taxi profits (1H: $72.3mil). In my opinion, on a long term basis, it is likely its Singapore taxi division will show the true extent of competition from Grab and Uber during its next financial year's results. I estimate CDG local taxis will make 40-45 million in profits annually, while 5-10 Million will come from its oversea taxi businesses.
Profit: s$50 million
Bus Station
A segment which I do not understand why LTA has left the assets to SBS Transit even though other assets of the public transport network has been bought. It could be a political decision to leave this cash cow in CDG's balance sheet to buffer it from competition because the segment is highly profitable (40% NPM).
Profit: s$12 million
Automotive Engineering
This segment supports vehicle maintenance and engineering for vehicles (including Comfort Cabs and SBS buses). Given that Comfort Taxis are piling the roads less often, expect a slight fall in this segment profit moving forward.
Profit: s$45 million
Inspection & Testing
This segment relates mainly to analysis on Vicom's profitability. Given that Cars in the 8 to 10 years age range is now declining on Singapore's Road, this reduces the number of vehicle inspections overall and thus it is unlikely for Vicom to replicate its profit highs; a slight decline is expected.
Profit: s$30 million
Other Segments
Its Car rental is facing some competition and expect profits to decline, however given the monopoly CDG has in driving schools in Singapore and better reputation in China, CDG is able to command a premium (and force Singapore Driving Students to pay a sky high fee)
Profit: s$20 million
Total Profits before Taxes and Non Controlling Interest (Financial income is netted off Finance Expense)
Based on the above, CDG's new profits should be s$327 million. If we were to adjust for estimated Tax Expense of s$62 mil and non controlling interest of s$61 mil, the overall net profit attributable to CDG's shareholders is s$204 million annually over the next 5 to 7 years. This is because of the high fixed cost structure of its taxi business due to the high bidding for COE prices.
Are Current Valuations justified?
Based on its current market capitalization of s$5 billion, the expected P/E is 25 times. In my opinion, the current valuation is too optimistic and CDG should be valued lower. Based on its past price earnings ratio in the region of 16 times, we should expect CDG to be valued at s$1.36 share price or s$3.3 billion market capitalization.
It is possible that Mr. Market is predicting the government may step in to protect Comfort Taxi and the rest, which means CDG's taxi business may not decline from s$150 million to s$50 million, but instead to s$100 mil profit level. This will make current valuations of CDG justifiable.
Assuming CDG's Taxi Business is not Profitable
In fact, my above analysis assumes that CDG's taxi business in Singapore remains profitable despite competition from Uber, Grab and Private Hire companies. If one had been utterly pessimistic and think that CDG's taxi business will break even (not even assuming loss making like Grab), the fair valuation of CDG has to be reduced by a further 20% to a price of s$1.10.
This is because Grab and Uber have been making losses and burning cash in their business. Furthermore, Grab has recently raised another round of funding from international investors, thus being able to up the ante against CDG.
As an investor seeking a margin of Safety, I may peg myself to the more pessimistic scenario before considering buying a stake in CDG.
<The author has no vested nor shorted interest in CDG>
Thursday 7 September 2017
Portfolio Update- Divestments and Seeking New Gems in a "Fairly Valued" Market
It has been a while since the last update of my stock portfolio. Th main reason is because I have made a few transactions over the months.
Divestments
Penguin Holdings – Sold all remaining 25,000 shares. This brought to the end of my infatuation with Penguin believing it was then riding on the oil boom in 2014 and being a low leverage company
Ezion - Sold 24,000 shares at 0.26 however my CPF portion was not sold and now I have to await the debt talks before deciding. The irony is that I had sold off my Ezion shares via CPF at 0.26 and bought it back at 0.22 as I sensed a trading opportunity (should have sold off and not bought back)
Silverlake Axis- Sold off at 0.620 before ex-dividends. This is because I believe the company is now fully valued and cash flow ability seems not to be as strong as before.
BBR holdings- Did a short term buy because BBR has been continuously doing share buybacks. Bought at 0.22, sold at 0.23
Ellipsiz- Sold it off today at 0.75
Accumulation
Over the past months, I had added on to FSL because of my belief that the fleet’s liquidation value, nett of debt, is above its market price of 7 cents plus. This were at various price points ranging from 7.5 cents to 8.2 cents. I do think there is value in the trust and I await the verdict to see if they have successfully rolled over their debts or otherwise.
Still Seeking Gems
With the various divestment, my cash holding is now at a 37% level. Paring down of my FSL stake is expected especially if share prices move above 10 cents. This is because the concentration risk is getting too high; becoming a binary bet.
I have tried looking for value in other companies. However, none of their free cash flow yield relative to current share price are at attractive levels. The two in my monitoring now are CSE Global and Sarine Tech. Other than that, I am currently finding little value in Singapore’s market.
Monday 4 September 2017
Saving $100,000 by 31
“How do I start to reach my financial goals?”
“What must I invest in?”
These are questions often asked as newcomers to the workforce embark on their goal to start saving for retirement. And the first steps to it is saving with a certain figure in mind. So how can one achieve this first financial milestone of saving, say their first $100,000? While many would think the ability to invest smartly is required to achieve this goal, the truth could not be any further.
Its more about Saving Habits than Smart Investing
In my view, if you have the goal of saving $100,000 before the age of 35 (or preferably 31), achieving your milestone depends more on how much you save than the ability to invest for wonderful returns.
Let’s use the example of “Ben” to illustrate. Following the path of most university graduates, Ben graduates and enters the workforce at the age of 25. There he attains a job with a monthly salary of $3,000 (After CPF: $2,400). Ben expects an annual 5% increment during the early stages of his career and intends to save a full 1 month of his bonus annually. In addition, being a new investor, Ben expects to invest in “safer” stocks which will yield him an annual investment returns of 4%.
Under $1,000 Monthly Expenses
As mentioned, Ben intends to keep his personal monthly expenditure to under $1,000 or about 40% of his take home pay. This is how his monthly expenditure will look like. Do note that while the insurance expense is low at $45, this is because term coverage of $200,000 and hospitalization insurance is utilized.

All in all, Table 2 shows how much Ben will save monthly. At the start of his working life, he is saving only about 30% of his monthly take home pay.
 |
| Table 2: Saving Table at age 26 & 30 |
Based on the calculations, Ben will save $100,000 when he is 31 years old.
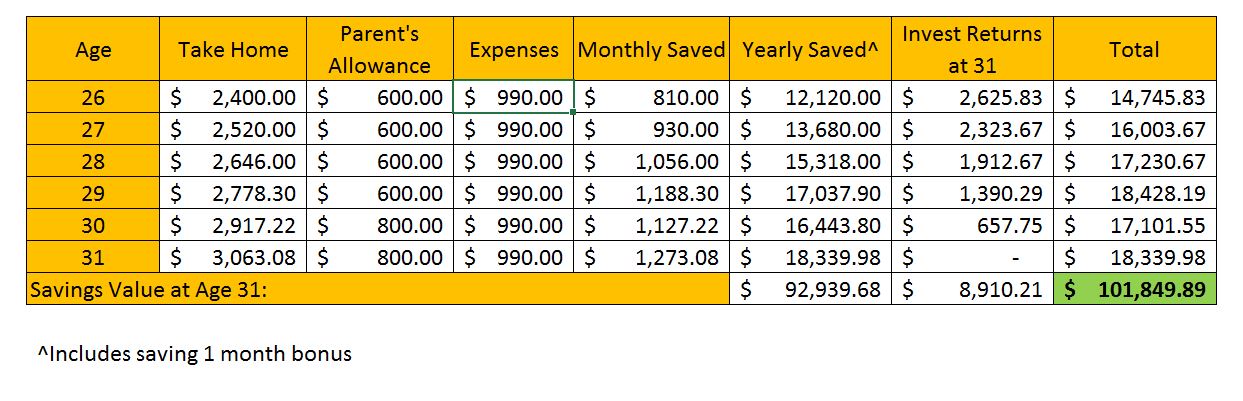
Analysis of how Ben achieved his $100,000
Based on Table 3, a significant portion of the $100,000 was due to Ben’s savings. In fact, only $8,910 was a result of his investment returns. To summarise, 91% of Ben’s financial milestone was due to his efforts of keeping monthly expenses low (below $1,000); enabling him to save 30-40% of his take home pay.
What if Ben had been Given Wrong Financial Advice or Spent More?
Let’s put additional thoughts to the above example. How would Ben’s milestone of $100,000 be affected if instead of spending $990 monthly, Ben spends $1,340 monthly. The reasons can vary such as instead of being advised to take Term insurance, Ben was offered Whole Life insurance (which will cost him $350 more monthly for the same coverage) or Ben simply decides to spend $350 more to pamper himself.
From a spending ratio of 30-40% of his take home pay, Ben’s spending ratio has now increased to the 43-55% range. Correspondingly, this will affect his savings ratio (a decline from an average of 39% to 26%).
 |
| Table 4: Saving Amount at reduced Saving Ratio |
At age 31, Ben will only be able to save $73,991. Hence, just a decision to 'spend more' or 'an advice to choose Whole Life instead of Term' sets him back a difference of $26,000. Ben has been delayed by approximately 2 years in achieving his financial milestone of $100,000.
Conclusion
To summarise, the financial milestone of $100,000 depends greatly on what you spend and the amount you save. From Table 3, it shows just how little investment returns contributes. It is only if we take a longer term horizon, will the compounding of investment returns be substantial to contribute to our wealth building. However, for our investment returns to be significant, we need to build a large capital base and this boils down to an individual’s spending and savings habit.
Lastly, some individuals (particularly insurance agents) will dispute the later part of this post where I have “expense” the differential where Whole Life insurance is involved. It is worth noting for individuals who purchase such policy, they will never get to see their maturity sum, hence such a sum/differential should never count towards their retirement fund. Suggestions such as surrendering the policy when they are older (i.e. age 65) may then be offered; however, such a surrender comes at a penalty, and it reduces the returns of whole life insurance to the region of 2-3% per annum. If that is the case, investing the differential on your own is a much better option.
Wednesday 23 August 2017
When can Whole Life Insurance be better than Term Insurance?
The topic of buying Life Insurance popped into my mind again recently when the Straits Times covered a topic of how Insurance Product options have expanded online and how it can be purchased without the need of going through agents. So perhaps it is a good time to re-evaluate when Term Insurance is better; and when Life Insurance is better.
Previously, I did a short write up of the common types of Insurance shown which can be read here. Hence if you need a basic understanding of how Term and Life insurance works, you may read it before continuing this post.
The "Money Psychology" associated with Term and Whole Life Insurance
My conversations with others on the topic of Term and Life Insurance has unveiled an interesting observation. Many individuals do not consider the value of their Whole Life Insurance policy when calculating their net worth or for retirement. This is intuitive because you yourself will never get to see the sum of money since... oh well you know. Hence many people view life insurance as an expense, whose premiums unfortunately form a significant portion of their take home salary.
Conversely for Term Insurance, as the premiums paid is so much lower than that of a Whole Life, one is able to save more. Currently, the premiums for a term insurance is approximately s$150 per year for a $100,000 coverage, while the premium for whole life insurance is about s$2,200 yearly. This means a savings of about s$2,050 yearly.
This is one of the reasons why you see a few bloggers possessing a 6 figure investment portfolio despite being in their late 20s or early 30s. It is simply due to the fact that they (we) use term insurance to insure ourselves instead of Whole Life (and also our high propensity to save ratio). As a result of this, society seems to think we are in a better position to retire early and better.
Let's show it mathematically through two individuals who plan to insure themselves for a $200,000 coverage - Mr T (who will utilize Term insurance) and Mr WL (who will use Whole Life). In a short span of 10 years, assuming a return of 4% earned on the difference, Mr. T will be ahead of Mr. WL by $49,225.


Savings over 10 years at 4% Average Returns
To summarize, individuals do not view Whole Life Policies as part of their retirement fund despite the premiums paid being much higher than that of Term. On the other hand, those who purchased Term insurance are able to see the tangible difference by a faster rate of accumulation in their bank balance; and if they were to invest wisely this difference, they will have a higher net worth compared to individuals on Whole Life. This sums up the "money psychology".
When can Whole Life Insurance be better than Term Insurance?
So the question beckons? When can Whole Life be better?
The answer boils down to the individual - i) when the individual is ill-disciplined in savings or ii) the individual is not very good in managing his money/savings.
Following from my above example, an individual will have an extra $4,100 yearly. He can either a) Save this amount or b) Spend it away. An individual who is indiscipline at saving or poor in managing his money will do exactly b); spending it away for present consumption and not saving for retirement.
Seen in this light, one will notice that Whole Life Insurance is in fact a form of "Forced Saving" scheme. This is because it takes a significant amount of your take home pay now, locks it away until the end of your life to help you benefit from the magic of compounding. Unfortunately, the downside is that you will not enjoy the maturity sum, only your beneficiary.
The Returns from Being Locked Away
So what do I mean by saying an individual is not good in managing his savings? Well it means not knowing how to put the money saved from term insurance into good use (returns). While Whole Life publishes that their projected returns are 4.75% etc, readers will know that the true returns for many such policies are approximately 4% per annum.
If an individual has the discipline and is able to make use of schemes such as POSB-invest saver or ETF to invest in a basket of shares belonging to companies of credible financial strength, achieving a long term average of 4% is achievable and feasible.
Similarly, if an individual is terrible in investing such that he is always making negative returns annually, then Whole Life might be a better option of locking away his savings for accumulation. However, an altering of his psychology has to be done to come to the realization that the maturity sum from his whole life is part of his retirement plan. Alternatively, he can try to surrender his policy near his 70s to use the proceeds to fund his retirement.
However surrendering a life policy is not the best option because it reduces the returns to the region of 2-3% per annum; which is pretty achievable if you had started by putting money in your CPF special account at the beginning (CPF SA provides 4% annual returns).
Summary
If you lack the financial discipline to save or is an individual who is unable to control one's own expenditure, Whole Life may perhaps be a better option scenario. This is because it acts as a form of "Forced Savings" that locks away part of your income for the future. Similarly, if your savings is generating less than 2% interest per year, utilizing a Whole Life policy to help in retirement planning may be an option as well.
It is at this juncture, that I would suggest to tap on another form of forced savings - topping up into your CPF Special Account. This is because it earns a close to risk free 4% returns with the benefits of a one-time tax deductions. However, there is a cap to how much you can top up into your CPF-SA.
Related Link: http://investmoolah.blogspot.sg/2015/09/this-is-better-than-singapore-savings.html
Monday 21 August 2017
Spend Less on Bubble Tea if you want to be rich and healthier

Most people would have heard about the money hack on cutting back on Starbuck's latte to increase your savings.
Some will have recently heard about Australian's Millionaire Tim Gurner rant on Advocado Toast and how it is making millennials poorer.
Locally too, we have a beverage (food) that is making Singaporeans poorer.
The Bubble Tea
Initially, I wanted to paste a picture of LiHo's or Gong Cha's Bubble Tea; however to avoid potential lawsuit for damaging their business, i guess better not! So down to the facts.
The Bubble Tea is a favorite Singaporean beverage and costs about $3- $3.50 per cup, especially among the younger generations. If an individual decides to reduce the occasions he drink on a weekly basis say from 5 times to only once. The annual savings will be: $3X 52X4 = S$624. That translates to about 20% of a young office worker's monthly take home pay.
And that's not all !
The Potential Health Downside to drinking too much Sugar Drinks (e.g. Bubble Tea)
Initially, I wanted to paste a picture of PM Lee's National Rally and the 'war on diabetes"; however to avoid any potential flaming by netizens of political affiliations etc, i guess better not! So down to the facts.
Recently, PM Lee delivered a somber fact that diabetes is becoming increasingly prevalent among Singaporeans. Let's face it, getting diabetes drains you financially because you will have to pay for the medical treatments, consultations etc.
And general knowledge tells you one of the main reasons why you get diabetes is because you have consumed too much sugar in your lifestyle. That's where the nasty bubble tea fits in - it has many cubes of sugar (even if we order at 50% sugar).
Hence while cutting down on drinking bubble tea provides you the instant savings of $624 annually, it also reduces your risk to diabetes, preventing from having to bear the financial strains of incurring medical expenses for diabetes.
Summary
To summarize and to build on and quite fellow blogger, Kyith's words: Diabetes can be traced to as a function of affluence and if you look at the insatiability of Singaporeans to go for gong cha, koi, llao llao. The hunger for such snacks borders on addiction and is becoming a problem.
Cutting down on such sugary treats will not only reduce our risk of health problems in the future. It will also save us money in the present. No doubt we Singaporeans are becoming more affluent; however our hunt for food filled with sophisticated and deep flavors should not come at too high a price, damaging our health and financial freedom goals.
Sunday 20 August 2017
A review of Starhub's Dividend Sustainability
From my previous post on Starhub on Feb 2016, I asked about the sustainability of the company's 20 cents dividend policy on a cash flow basis. You can read the previous article here.
Since then Starhub has reduced its dividend policy to 16 cents annually. This means Starhub has to generate $277 Mil of cash to deliver its 16 cents dividends.
What has happened?
Since then, Starhub has experienced 2 events.
Firstly, the issuance of a s$200 mil perpetual securities with a 3.95% yield. In my opinion, the proceeds from this perpetual securities is likely to be used for to repay Starhub's maturing debts such as its Sept 2022 bonds. Hence, it is likely this perpetual securities is used as an instrument to roll over Starhub's debts to a longer duration.
Secondly, Starhub has experienced a deterioration in its business environment and erosion of its moat. In its recent Q2 results, Starhub experienced a net profit drop of 20%. Its pay TV and mobile segments saw a fall in revenue and user subscription. Fortunately, Starhub's cash generation ability did not deteriorate by 20% in tandem. From the results, Starhub's operating cash flow before working capital changes for the first half of the year was s$339 million; and if we are to extrapolate it on an annual basis, the company is generating about s$678 million per year.
Are the New Dividends Sustainable?
So to recap, Starhub now needs a free cash flow of s$277 mil to support its dividends. With an extrapolated cash flow generation ability of s$678 mil, we will have to deduct the following few cash outflow items first:
i) Maintenance Capex - s$300 mil (based on past annual reports)
ii) Income Tax of about s$60 mil
iii) Finance Expense of s$30 mil (based on Q2 results)
iv) Annual distribution to perpetual holders of s$7.9 mil
In addition, I have estimated that Starhub will be receiving about s$10 million in government grants. This is about a 66% fall from previous FY but a rather fair estimate as seen in its cash flow statements
This leaves Starhub with s$290 million to distribute as dividend or about 95% of its estimated cash flow generation ability or nearly 100% (if we exclude government grants)
To conclude, it seems Starhub has just about sufficient cash flow to support its current dividends. However, with such a huge amount of debt in its balance sheet and the increasing competition experienced in the mobile segment, it may be prudent for Starhub's management to re look at its dividend policy. Perhaps one good way is to announce that the company will distribute 90% of its free cash flow instead of guiding for a fixed amount of dividends it will give on a yearly basis.
Since then Starhub has reduced its dividend policy to 16 cents annually. This means Starhub has to generate $277 Mil of cash to deliver its 16 cents dividends.
What has happened?
Since then, Starhub has experienced 2 events.
Firstly, the issuance of a s$200 mil perpetual securities with a 3.95% yield. In my opinion, the proceeds from this perpetual securities is likely to be used for to repay Starhub's maturing debts such as its Sept 2022 bonds. Hence, it is likely this perpetual securities is used as an instrument to roll over Starhub's debts to a longer duration.
Secondly, Starhub has experienced a deterioration in its business environment and erosion of its moat. In its recent Q2 results, Starhub experienced a net profit drop of 20%. Its pay TV and mobile segments saw a fall in revenue and user subscription. Fortunately, Starhub's cash generation ability did not deteriorate by 20% in tandem. From the results, Starhub's operating cash flow before working capital changes for the first half of the year was s$339 million; and if we are to extrapolate it on an annual basis, the company is generating about s$678 million per year.
 |
| Starhub's cash flow Statement as of Q2FY2017 |
Are the New Dividends Sustainable?
So to recap, Starhub now needs a free cash flow of s$277 mil to support its dividends. With an extrapolated cash flow generation ability of s$678 mil, we will have to deduct the following few cash outflow items first:
i) Maintenance Capex - s$300 mil (based on past annual reports)
ii) Income Tax of about s$60 mil
iii) Finance Expense of s$30 mil (based on Q2 results)
iv) Annual distribution to perpetual holders of s$7.9 mil
In addition, I have estimated that Starhub will be receiving about s$10 million in government grants. This is about a 66% fall from previous FY but a rather fair estimate as seen in its cash flow statements
 |
| Starhub Q2 cash flow Statement (Financing Activities) |
To conclude, it seems Starhub has just about sufficient cash flow to support its current dividends. However, with such a huge amount of debt in its balance sheet and the increasing competition experienced in the mobile segment, it may be prudent for Starhub's management to re look at its dividend policy. Perhaps one good way is to announce that the company will distribute 90% of its free cash flow instead of guiding for a fixed amount of dividends it will give on a yearly basis.
Friday 28 July 2017
Is the Lease Buyback Scheme a worthwhile option to monetize your home?
Came across a blogger's post about the Lease Buyback Scheme (LBS) available at HDB. This pique my interest and I decided to check out its info graphics at HDB's website.
HDB Info graphics
Quoting directly from HDB's website its example of LBS. This is what I get below.

From the Info Graphic, we can infer two assumptions: i) a 65 year old flat is valued at $450,000 and ii) at the tail end of its 35 year lease, the HDB flat is valued at approximately $190,000. Let's delve into the two assumptions further.
Leasehold Valuation of Singapore Property
The Singapore Land Authority (SLA) has a leasehold table which shows how much value of your property is retained as the number of years on its lease runs down. The detailed breakdown of the leasehold table can be found here on page 3.
From the table, a property of 65 year lease remaining will retain 83% of its value; while a property with a remaining lease of 35 years will retain 64% of its value if we are to follow SLA's table. That means if you had bought a brand new 99 year HDB flat at $545,000; with 65 years left on its lease, the property should be valued at approximately $450,000 and when it has 35 years of its lease left, the valuation should be approximately $348,000.
Comparing HDB's illustrated example and following from SLA's valuation table, the difference in value of selling the tail end of your flat lease to HDB vs at the open market is about $148,000 (including the $10,000 LBS bonus which HDB gives on top of the $190,000). To summarize, you may be making a loss of $148,000 (in today's value) by signing to LBS compared to selling it in the open market in the future.
A few thoughts
The simple exercise has opened a few thoughts in my mind:
Does it mean that HDB valuers hold the view that should an influx of HDB owners decide to sell their 35 year lease remianing HDB flat, they would not be able to sell at the market predetermined value? If so, does it mean SLA's Leasehold Table does not apply to HDB's flat? And does it mean we should be depreciating our HDB flat's value at a faster rate?
In fact the appreciation of our HDB's flat value may not be as great as we think because depreciation at the front end of the lease is in fact higher than what we think; resulting in a much lower valuation at the tail end of the lease.
Conclusion
Based on HDB's illustrative example, it does not make much financial sense to take the LBS scheme unless you hold a very pessimistic outlook that prices of Singapore property market is set to fall by about 42.5% in real value during your lifetime. Contrary to what majority of the population is expecting.
Let's Gather Data
No doubt that the example HDB provides may be only illustrative by nature and they are in fact paying $340,000 to flat owners who are surrendering the tail end of their flat's 35 year lease under LBS.
However, all of these will require true data. For those who have signed for the LBS, You may comment below or email me at Cychan0913@gmail.com
Do Provide the following:
HDB Info graphics
Quoting directly from HDB's website its example of LBS. This is what I get below.

Source: HDB Lease Buyback Scheme (as of 28 July 2017)
From the Info Graphic, we can infer two assumptions: i) a 65 year old flat is valued at $450,000 and ii) at the tail end of its 35 year lease, the HDB flat is valued at approximately $190,000. Let's delve into the two assumptions further.
Leasehold Valuation of Singapore Property
The Singapore Land Authority (SLA) has a leasehold table which shows how much value of your property is retained as the number of years on its lease runs down. The detailed breakdown of the leasehold table can be found here on page 3.
From the table, a property of 65 year lease remaining will retain 83% of its value; while a property with a remaining lease of 35 years will retain 64% of its value if we are to follow SLA's table. That means if you had bought a brand new 99 year HDB flat at $545,000; with 65 years left on its lease, the property should be valued at approximately $450,000 and when it has 35 years of its lease left, the valuation should be approximately $348,000.
Comparing HDB's illustrated example and following from SLA's valuation table, the difference in value of selling the tail end of your flat lease to HDB vs at the open market is about $148,000 (including the $10,000 LBS bonus which HDB gives on top of the $190,000). To summarize, you may be making a loss of $148,000 (in today's value) by signing to LBS compared to selling it in the open market in the future.
A few thoughts
The simple exercise has opened a few thoughts in my mind:
Does it mean that HDB valuers hold the view that should an influx of HDB owners decide to sell their 35 year lease remianing HDB flat, they would not be able to sell at the market predetermined value? If so, does it mean SLA's Leasehold Table does not apply to HDB's flat? And does it mean we should be depreciating our HDB flat's value at a faster rate?
In fact the appreciation of our HDB's flat value may not be as great as we think because depreciation at the front end of the lease is in fact higher than what we think; resulting in a much lower valuation at the tail end of the lease.
Conclusion
Based on HDB's illustrative example, it does not make much financial sense to take the LBS scheme unless you hold a very pessimistic outlook that prices of Singapore property market is set to fall by about 42.5% in real value during your lifetime. Contrary to what majority of the population is expecting.
Let's Gather Data
No doubt that the example HDB provides may be only illustrative by nature and they are in fact paying $340,000 to flat owners who are surrendering the tail end of their flat's 35 year lease under LBS.
However, all of these will require true data. For those who have signed for the LBS, You may comment below or email me at Cychan0913@gmail.com
Do Provide the following:
- No of years of lease sold under LBS;
- The total value all homeowners obtained from LBS;
- No of years left in your HDB's lease (include the years of lease sold to HDB under the LBS);
- Location of flat by stating which MRT Station it is closest to;
- Rough distance of how far the flat is from that particular MRT station [Please state in Km or if it is only 500 meter and below from the MRT station, just state 500 meters] (From there, I will be able to get a rough sensing of where the flat is and seek out its resale value by using HDB's resale flat price inquiry.)
Saturday 15 July 2017
How a trip to Courts offered me Personal Finance Lesson and its Company model
Recently, my laptop that had accompanied me since my last year of university has been acting up; a sign that a tech refresh to a new laptop may be needed. So I was off for a window shopping trip to identify a laptop good for writing and reading annual reports.
Flexi Plan (which will put you to ruins)
One of those that caught my eye (because it was literally big) was a Lenovo 15.6" inch laptop. It screen size was big and ideal for staring at annual reports and investing forum. Not sure if it was reasonably priced, but it was going selling for $1,499; but what caught my attention even more was Court's Flexi Plan, an installment plan
Apparently at Courts, you can buy many items on installment; and for this laptop, it was being offered on a 60 month installment plan for $61 monthly.
While the monthly installment sum seemed small, the maths didn't add up. For the laptop on installment, I will be paying a cool $3,660 after 5 years for it.
Courts Business Model
Courts has a pretty unique business model- 1) It sells furniture and IT accessories at its retail price for a small margin and 2) It sells furniture and IT accessories in installments at a high margin. Essentially courts is a financier offering consumers "money" to buy items at a loan shark high rate. In fact, in its recent full year results, Courts proudly presents its revenue mix.

Fortunately for the Singapore segment, a small but still significant portion of consumers are tapping on Courts's Installment Plan to finance their furniture and IT accessories purchases. In my opinion, that is still a crazy amount of people taking themselves on a journey of financial ruin.
Of course, to shareholders of Courts Asia, this is music because Courts is able to earn a fat profit margin as it is lending money to consumer at a high interest rate.
Flexi Ruin Plan
Back to my laptop plan. A simple maths will show that over the installment plan, I will be shelling out $3,660 for the laptop if I do not pay $1,499 for the laptop upfront. That is nearly 244% of the upfront retail price Courts is selling. For $3,660, I would have been able to afford 2 of the same laptop and still be able to buy a brand new Xiaomi hand phone from the spare change!
Seriously, who are those 18.2% on Courts credit scheme?
Let's reverse the scenario. Assuming you put $1,499 in a bank product and wish to withdraw $61 monthly to fund your retirement for the next 5 years. How much must your $1,499 grow annually to fund this?
The answer is a 45.14% annul return.
If you are to ask me: achieving a 45.14% annual return over the next 5 years is no easy task. In fact even the world's best investors including Warren Buffett wont be able to match that. So why should consumers punish themselves by being on these monthly installment plan which are charging a hefty rate (even more than credit card interest)?
No doubt, it is likely there are many people who will default on Court's Installment Plan but that is because the hefty interest rate is killing them. The above is a simple example of a bad debt and how you can lead yourself on a path of financial ruin.
Sunday 18 June 2017
Low Oil Price for a Long Time
Let's face the facts: Low oil prices are here to stay for a while.
Despite OPEC's commitment to continue supply cuts until mid 2018, the world is still producing more oil than it needs (similar to our local property oversupply and global container ship glut). In addition, Singapore is now set to be one of the largest "parking lots" for large crude oil tankers as covered in this article. In my opinion, low oil prices are expected, to 2019; because i) oil supply outstrips global demand due to production increase by USA and Nigeria and ii) the need to draw down on excess inventories built over the past 4 years.
It is this current scenario that investors will have to consider and position our investments.
Consequences
What are the consequences? There are many but all are hypothetical reasoning - oil & gas offshore support industry (e.g. Ezra, Mermaid) will continue to suffer from overcapacity, more foreign worker layoffs in O&G sector will mean less demand for rental housing, etc.
This comes to show how beyond the element of quantitative investing (e.g. P/E ratio, Free cash flow calculation), investing too carries the element of qualitative analysis - What is the future trend, how is each company affected by it and is their current balance sheet/management structure able to withstand it?
As for me, I am positioning for an upturn in the tanker charter markets (which too is experiencing an increase in new build tanker deliveries, a potential oversupply)
It is important that each individual forms his/her own opinion (investment thesis) based on the trend and how one expects it will progress. Hence, feel free to share your thoughts in the comments below on the current market trends.
*[Spams are not welcomed! I am referring to you spam bots, for the recent littering of comments which I have to clean]
^(Accumulated more FSL Trust and monitoring semi-conductor related stocks)
Subscribe to:
Posts (Atom)